Overview
We trained a lot of models - probably somewhere ~50 different ones. We compared a variety of different ofr one common dataset. The data for the corresponding models can be seen in the following figure:
In Action
The above loss figure does not always provide the best picture of how a model performs. Below are screen captures of the various different models.
Disclaimer: These are short clips and not representative of the absolute behaviour
5 timesteps 6 “neurons”
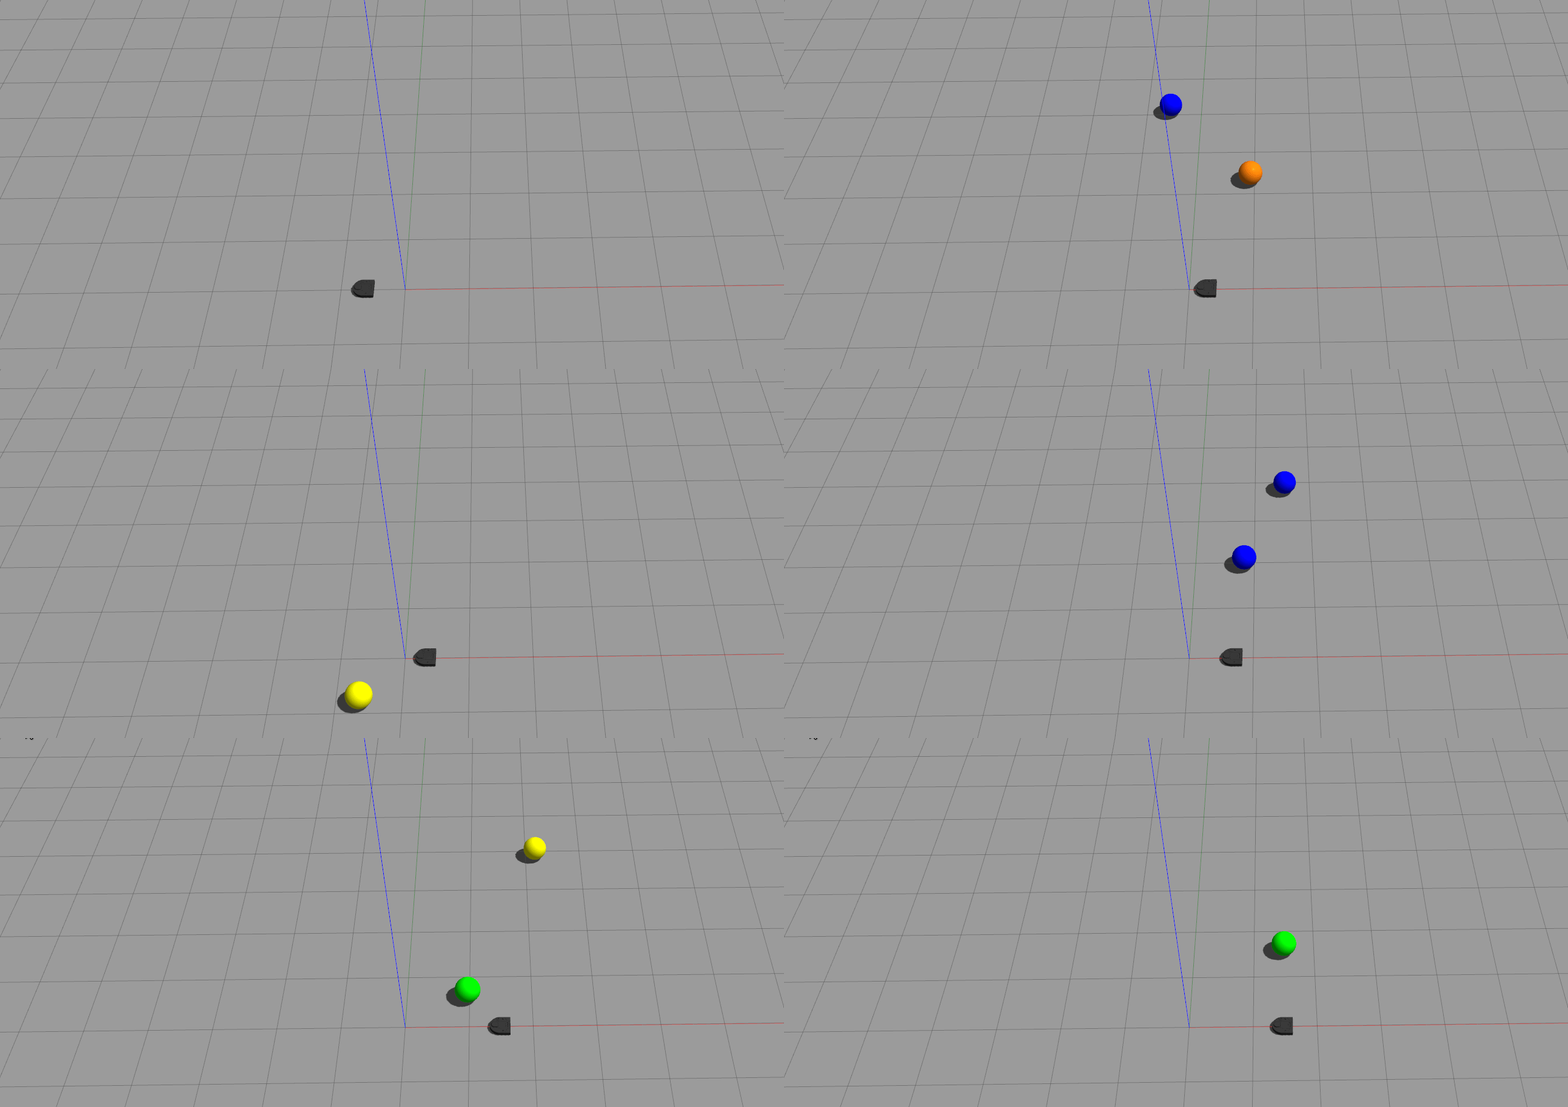
5 timesteps 8 “neurons”
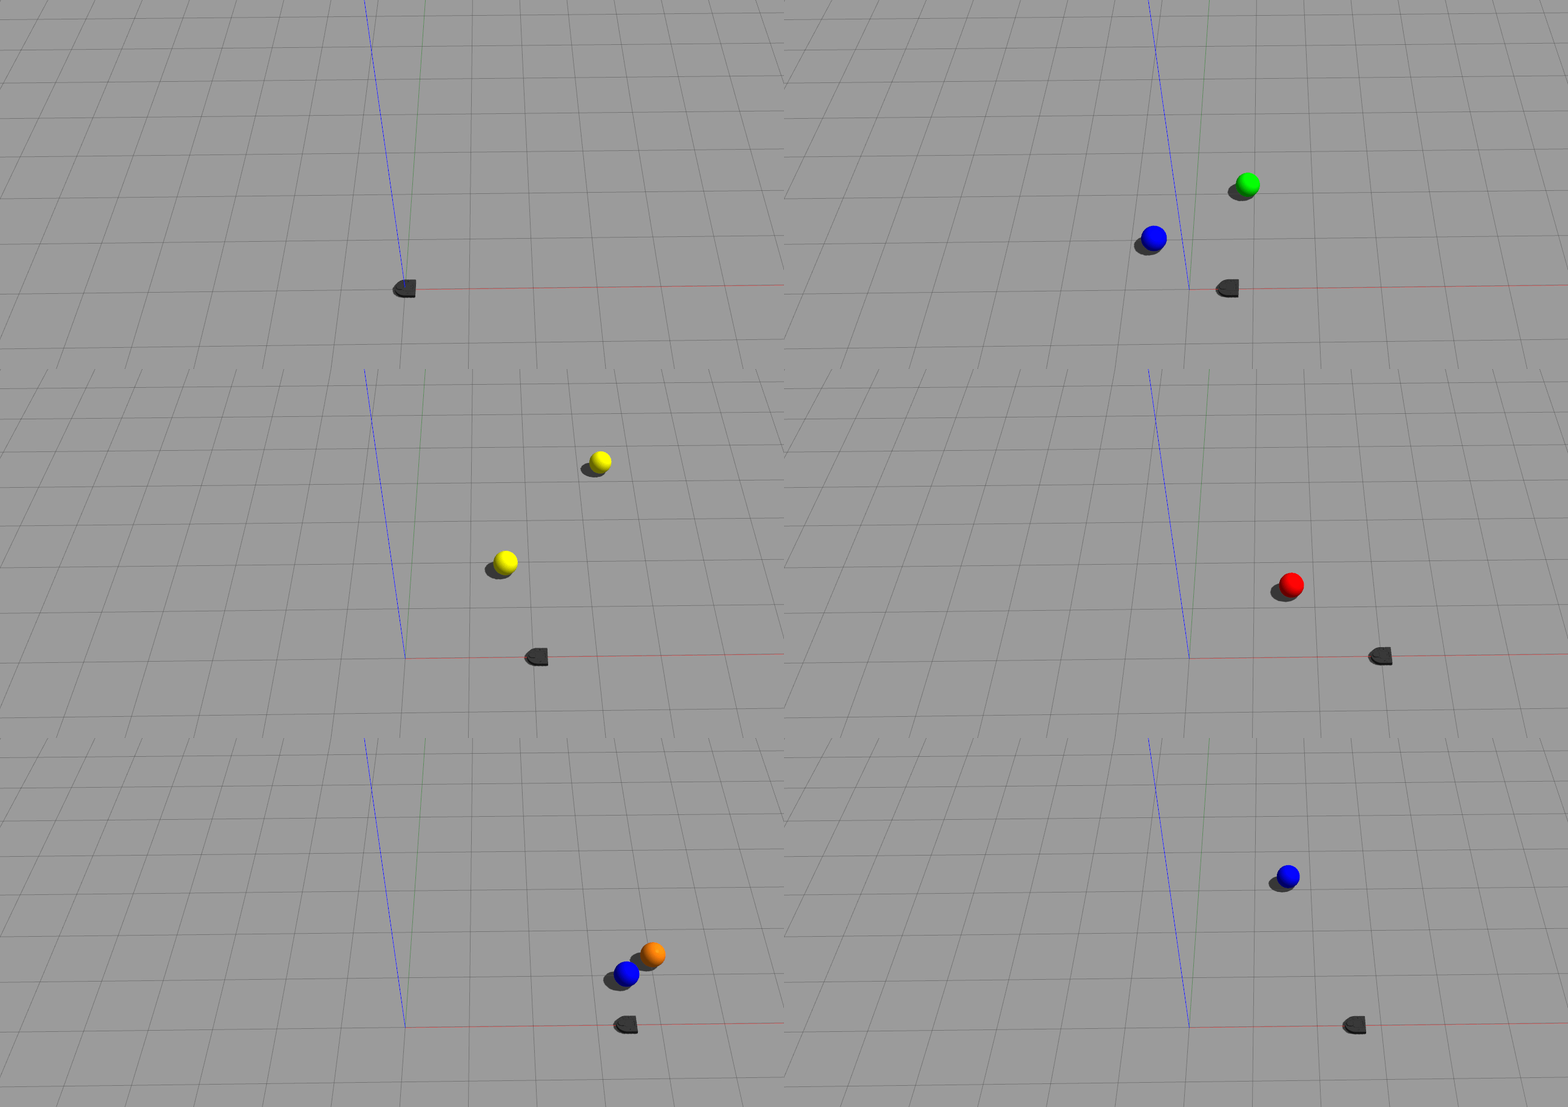
5 timesteps 10 “neurons”
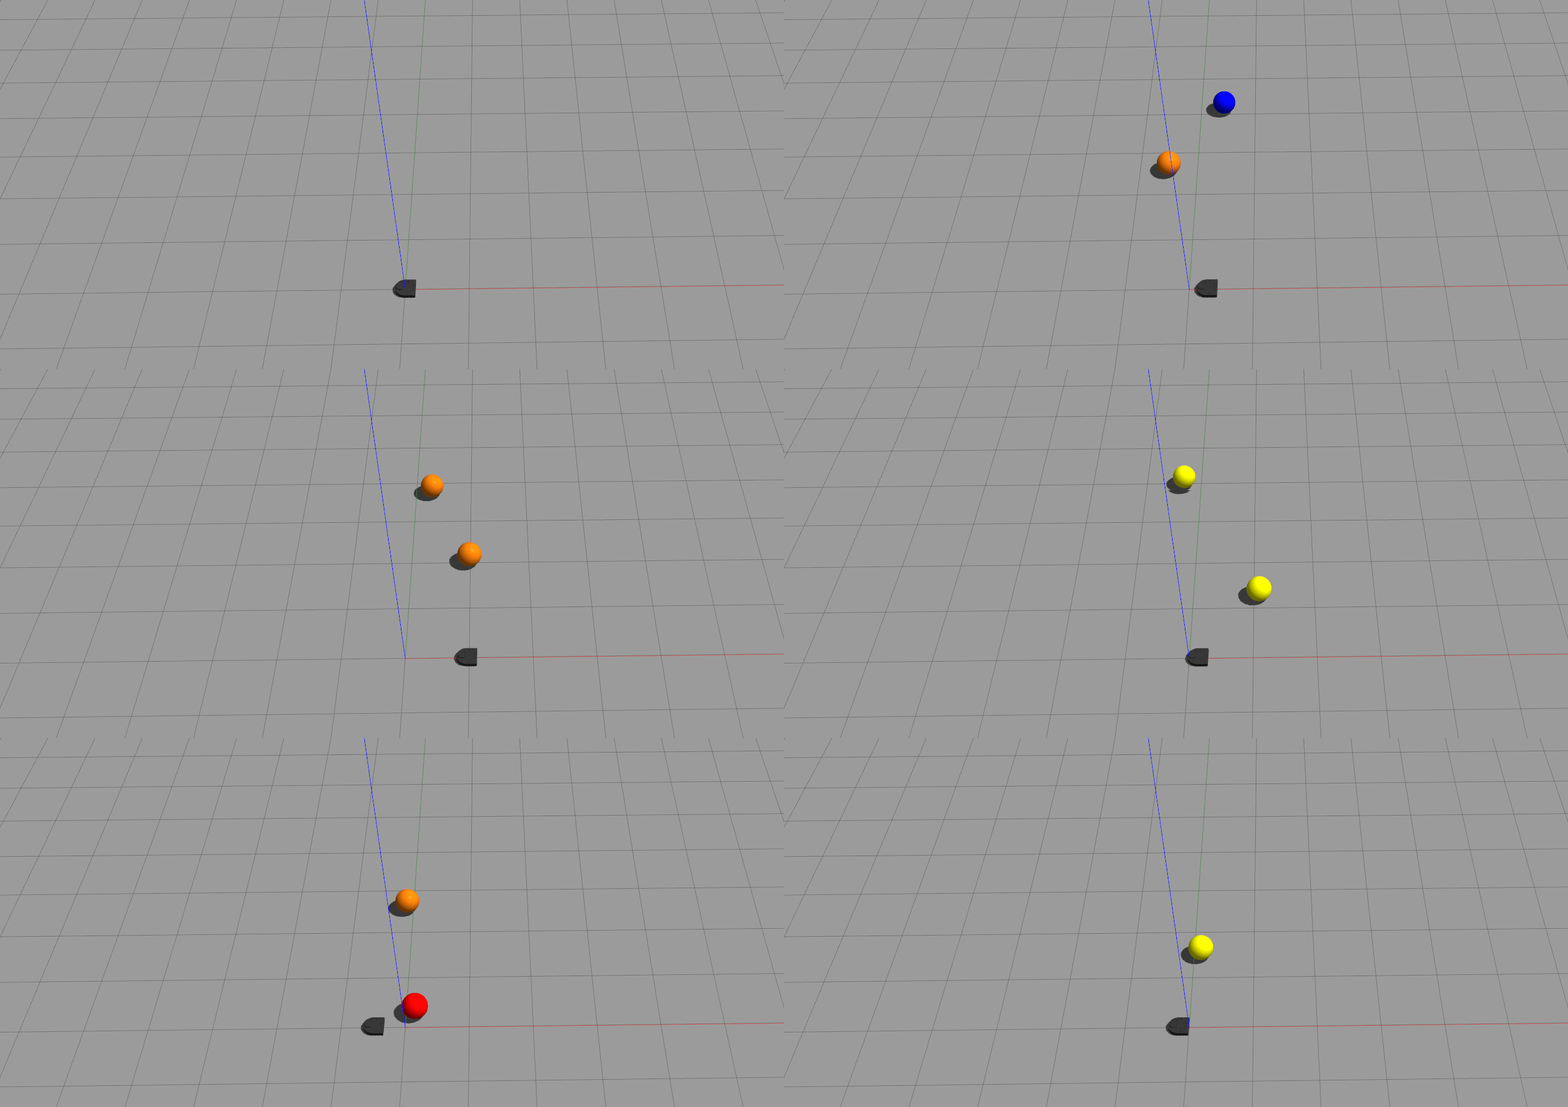
5 timesteps 15 “neurons”
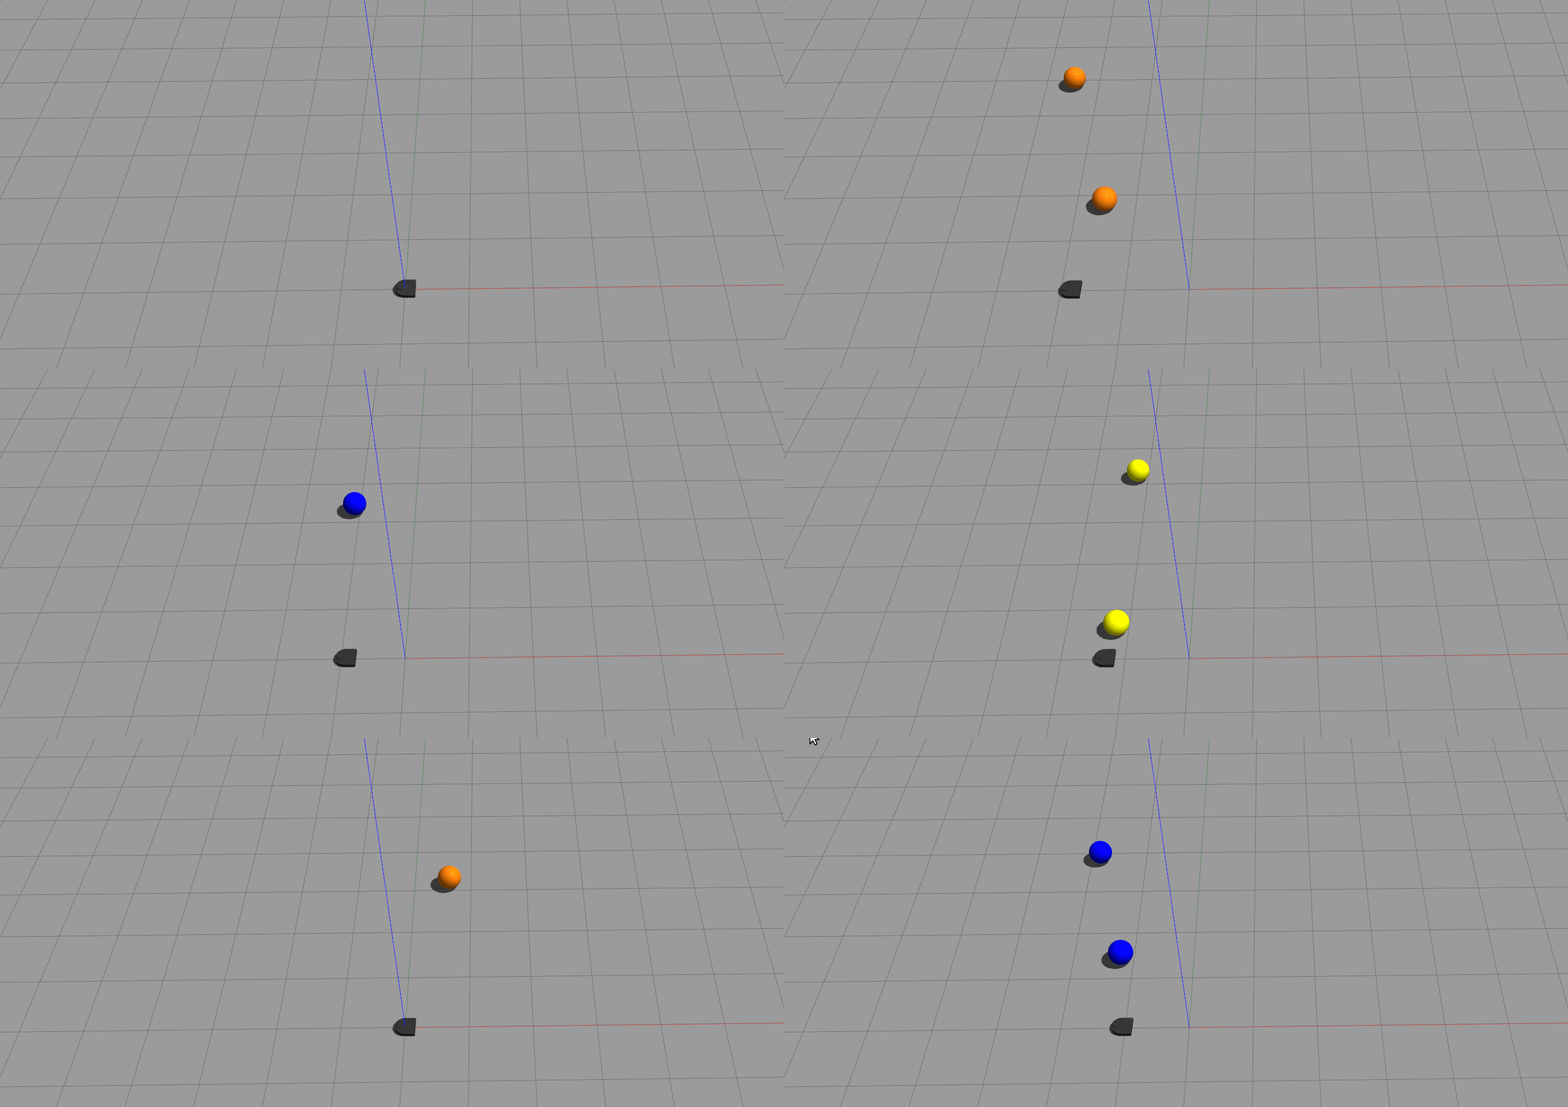
5 timesteps 20 “neurons”
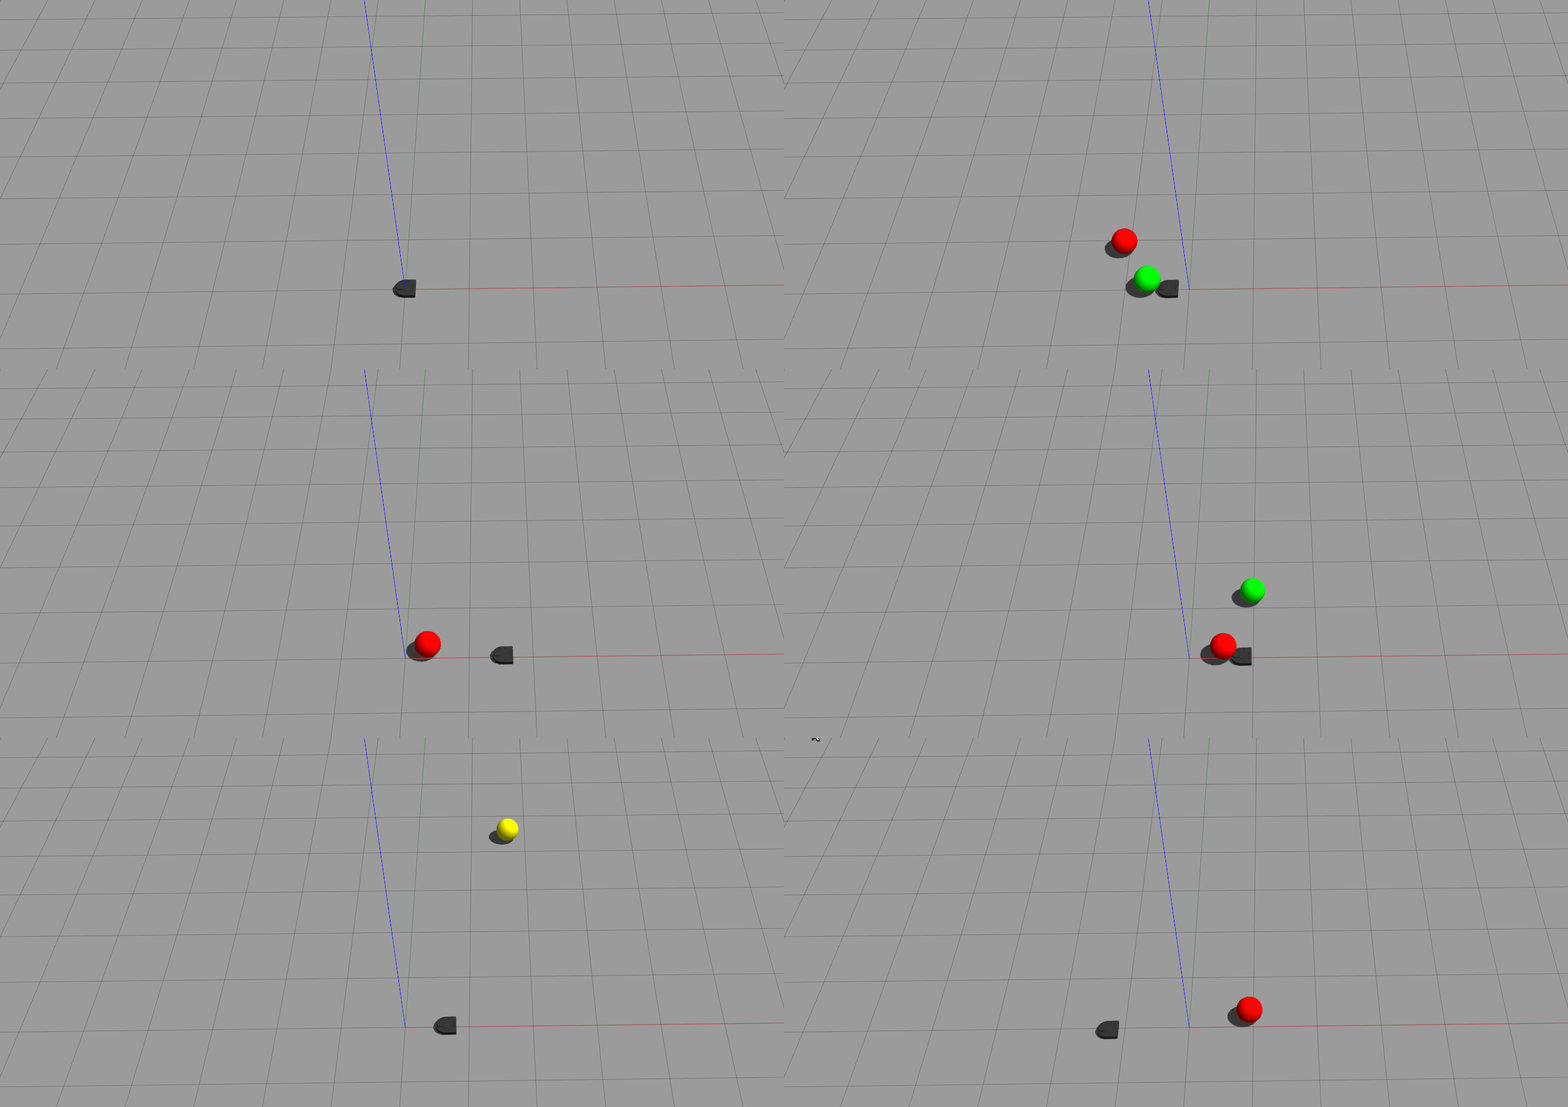
8 timesteps 10 “neurons”
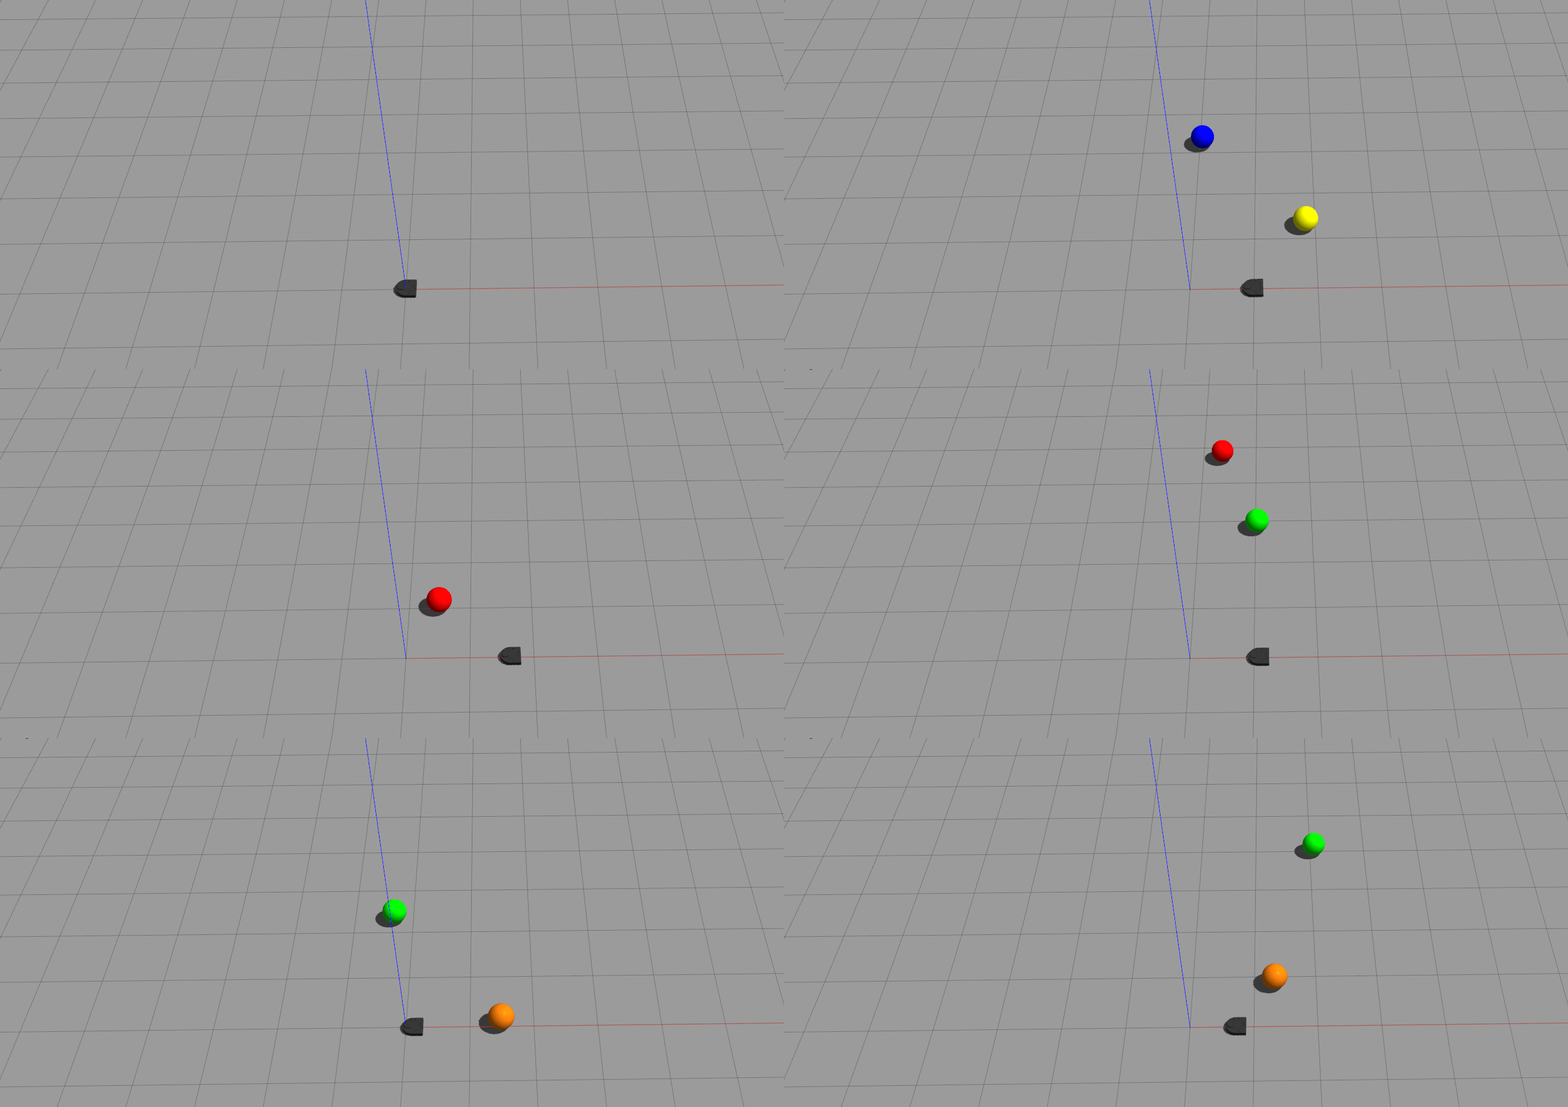
8 timesteps 15 “neurons”
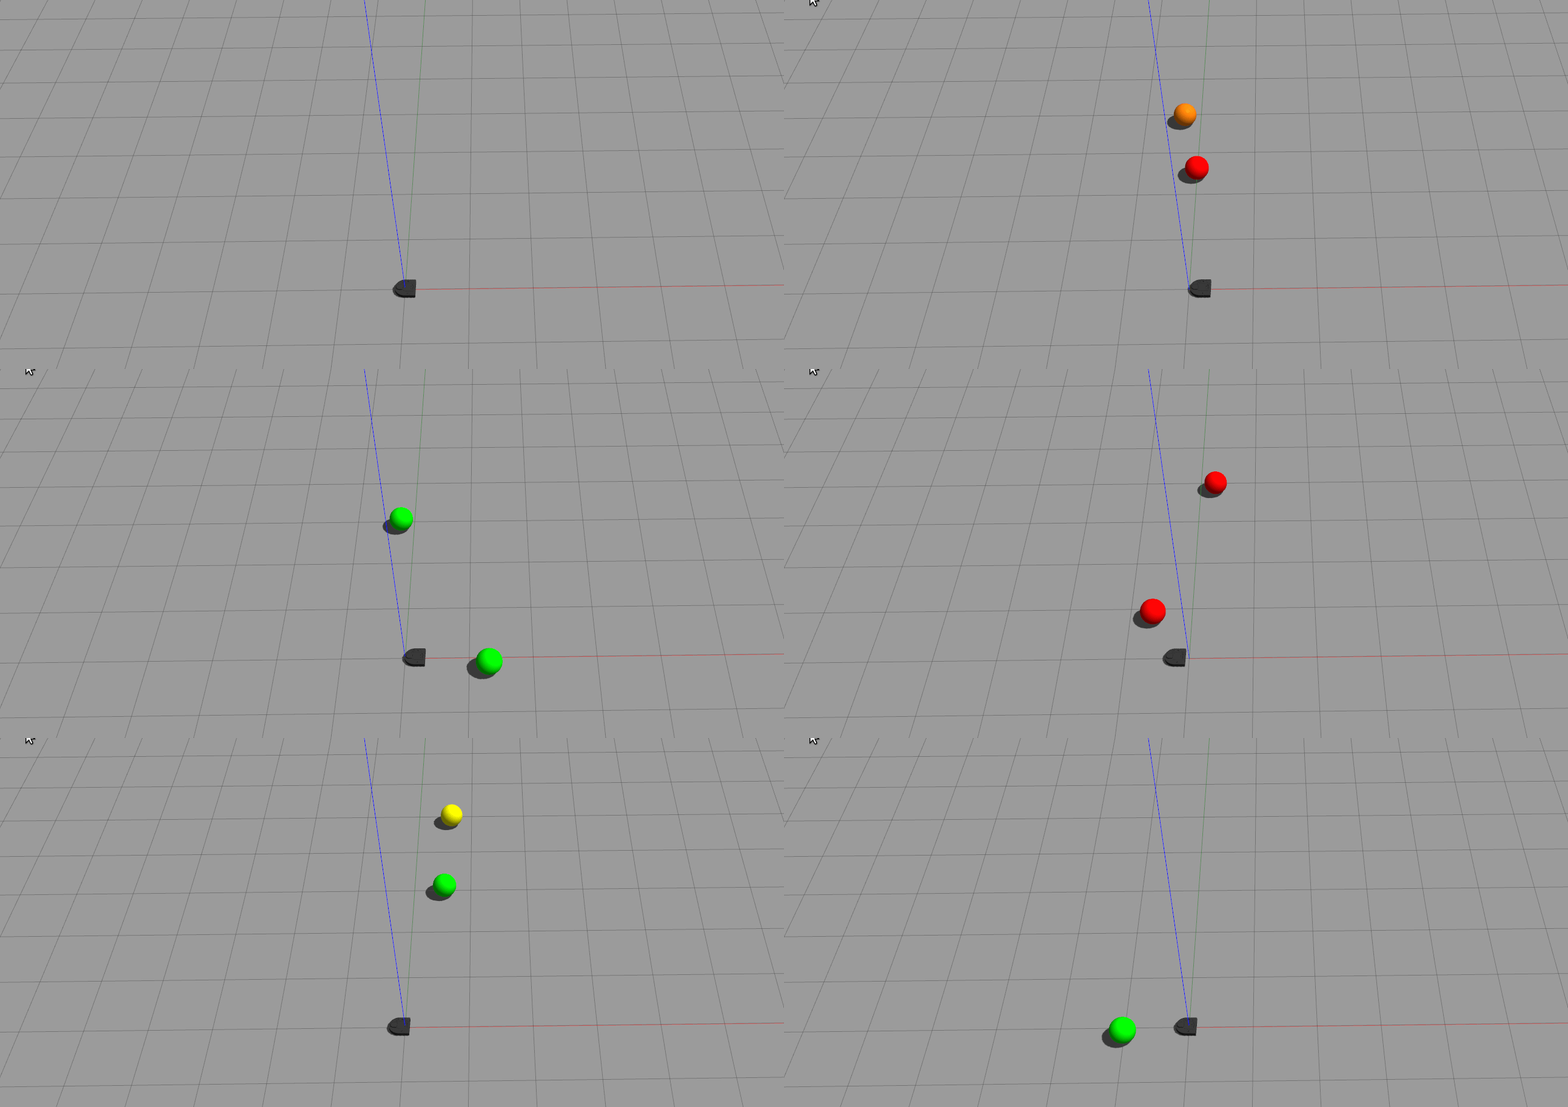
8 timesteps 20 “neurons”
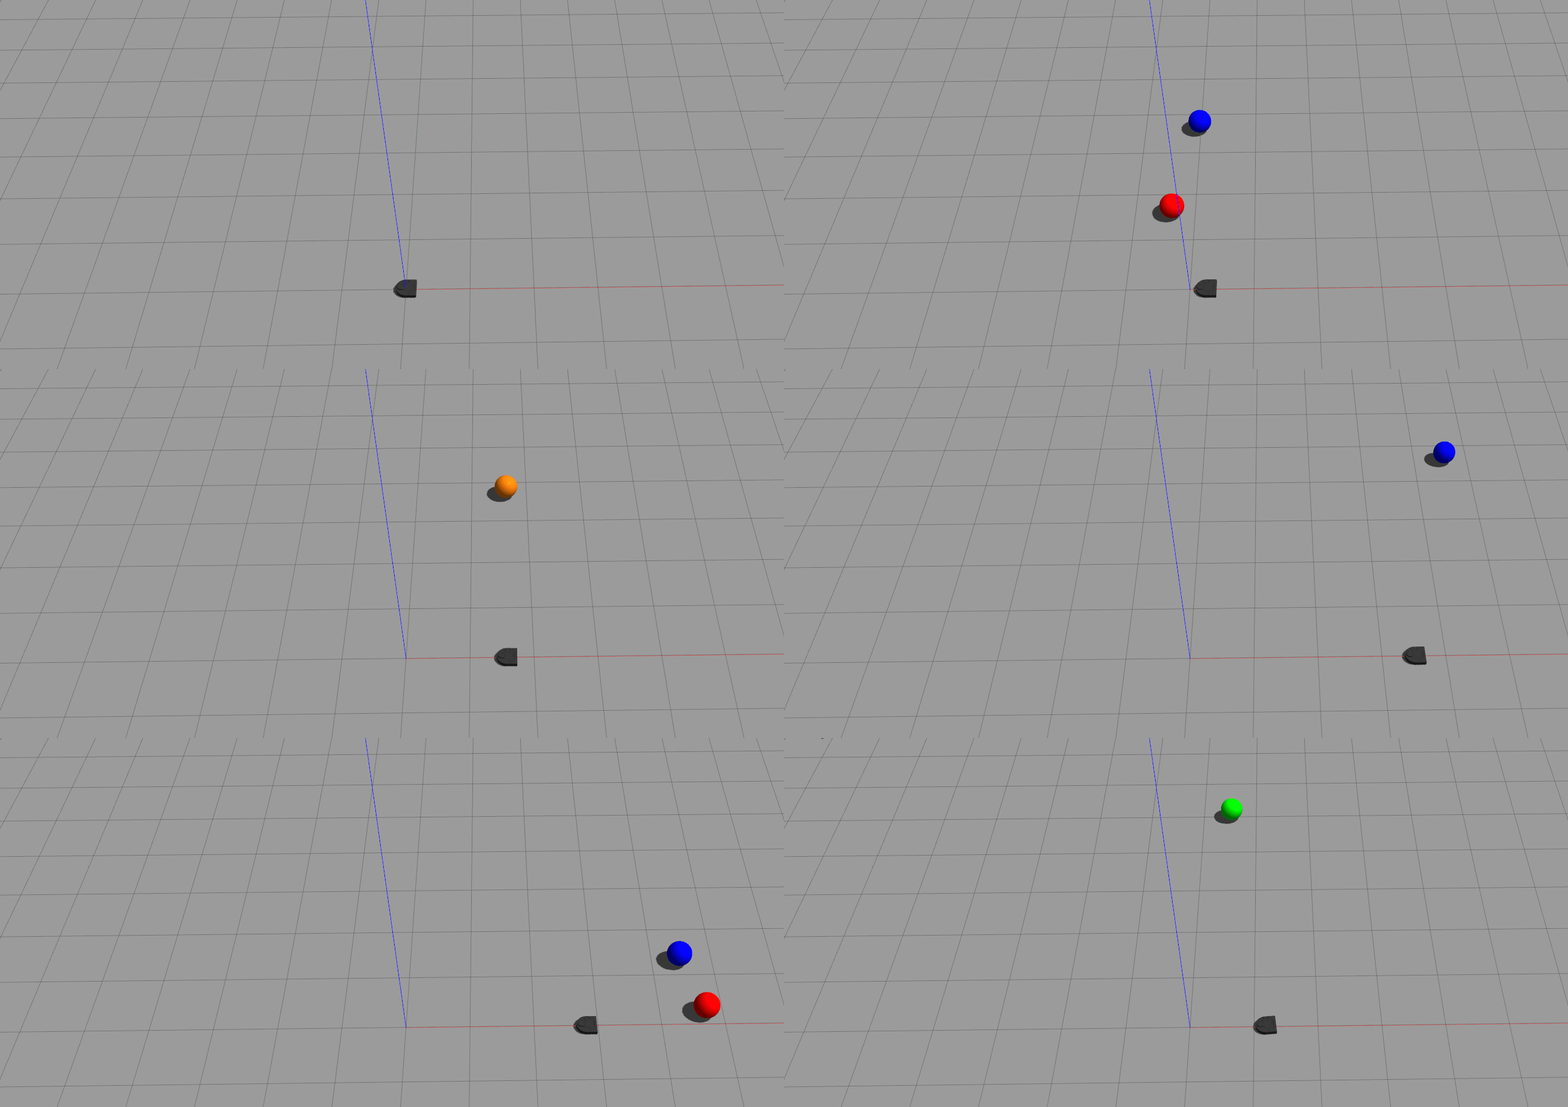
10 timesteps 15 “neurons”
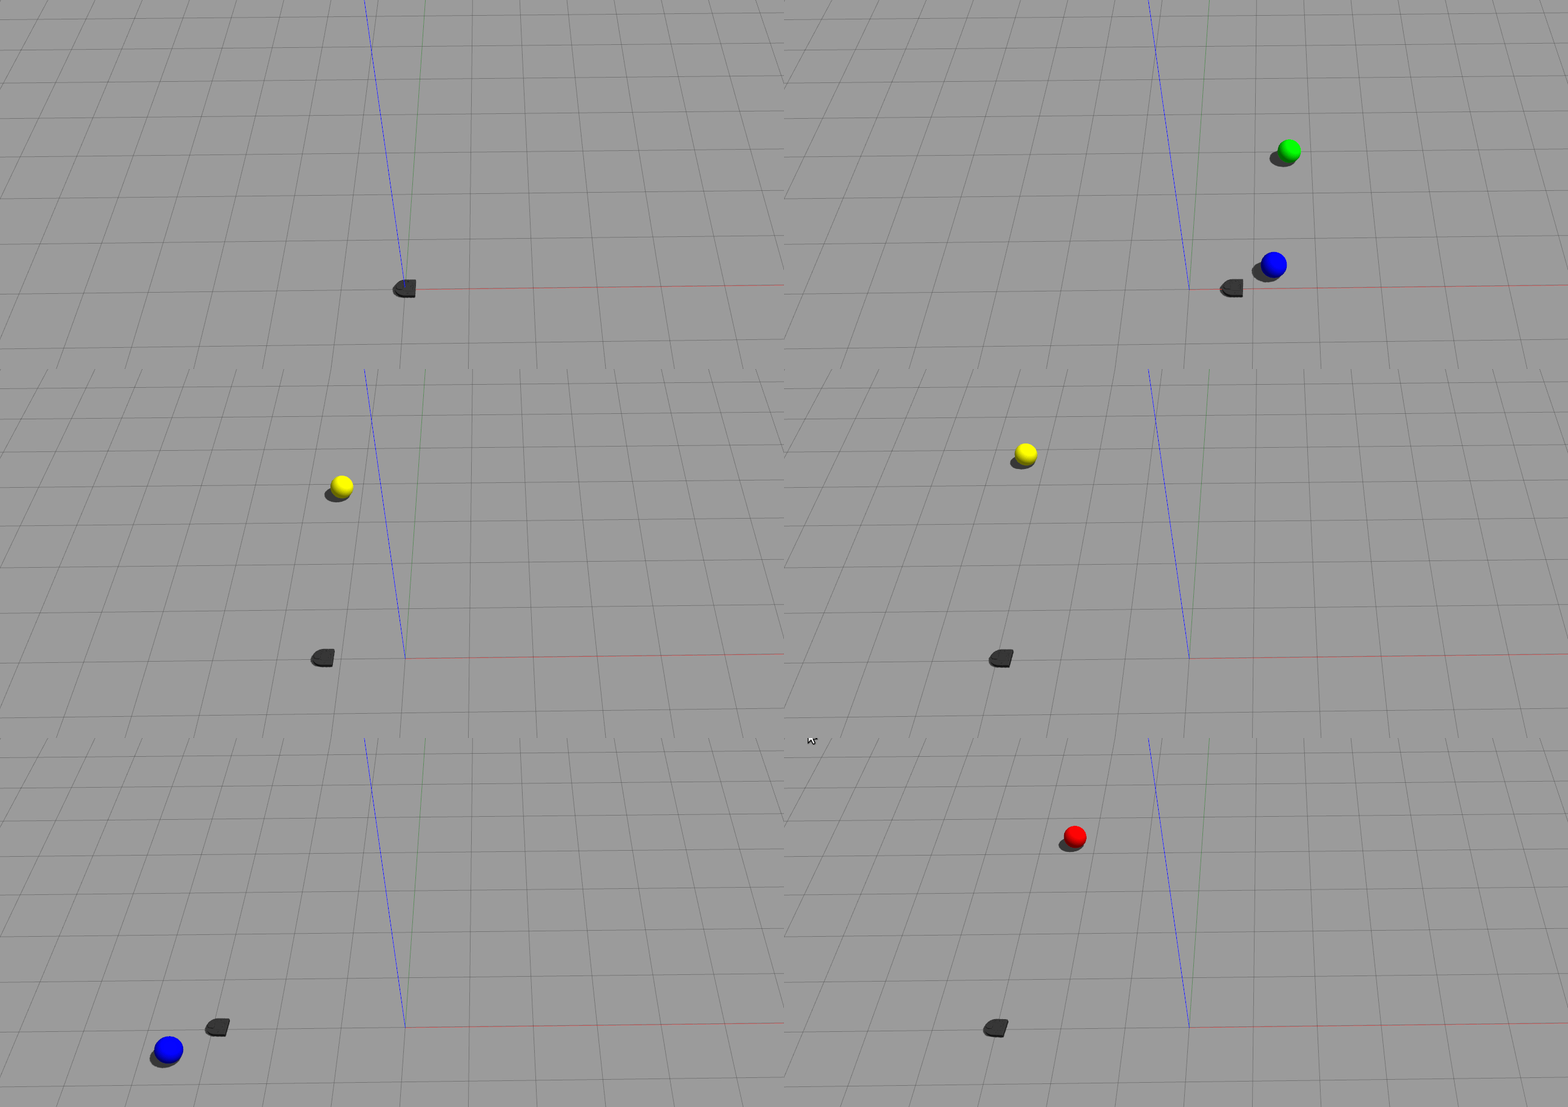
10 timesteps 20 “neurons”
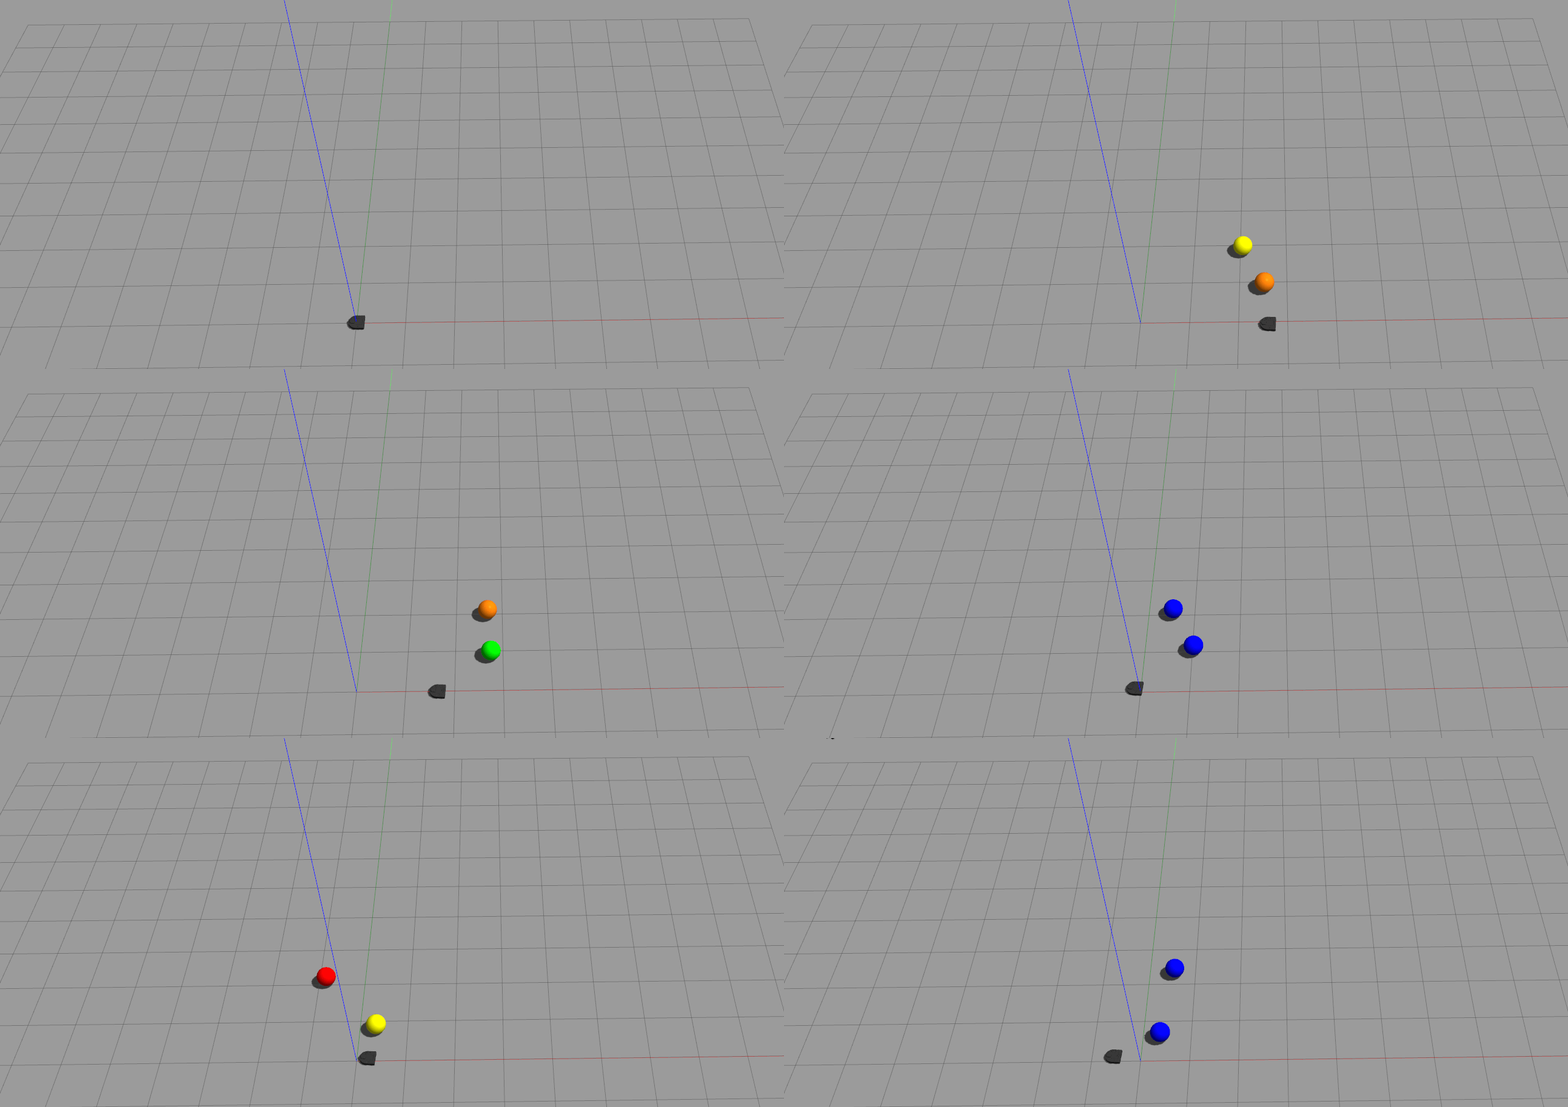
5 timesteps 10 “neurons (This used ALL datasets, which included slightly different inputs and styles of control)”

